Stretched Thin: 2025 State of BC’s Non-Profit Sector
Interactive Data Dashboard
Explore the Data
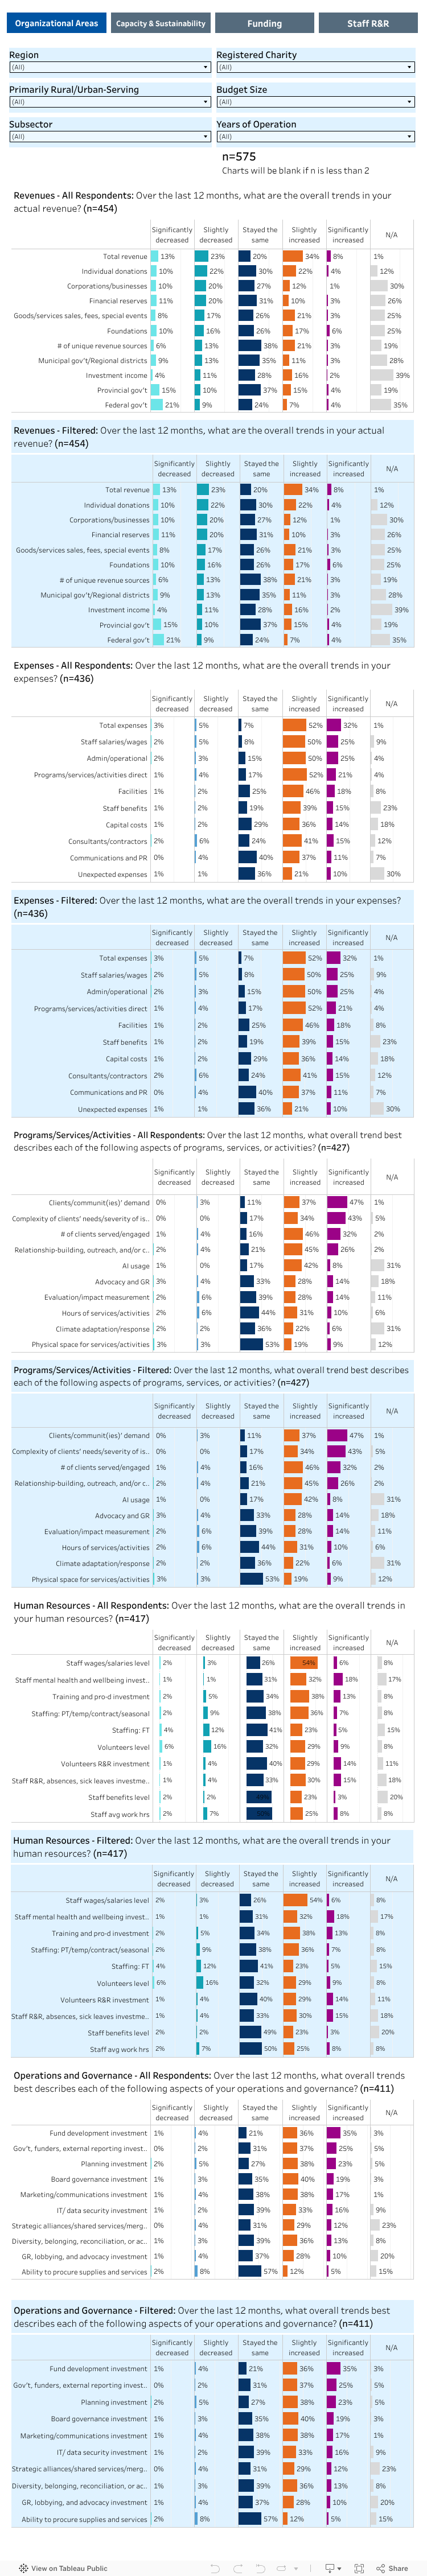
The 2025 State of BC’s Non-Profit Sector Survey dashboards make it easy to explore what’s happening across our sector in British Columbia. They’re designed to give everyone — from survey participants to community partners — open, visual access to the data they helped create.
How to use the charts:
- Use the four buttons at the top to move between themes and see the related charts.
- When you apply filters, the charts shaded in light blue will update to reflect your selections.
- The n= number at the top shows how many people answered at least one question in the full survey.
- The n= number above each chart shows how many responded to that specific question, or, at least one of the questions included in that specific chart.
Use these insights to inform your messages, strengthen your advocacy, and tell the collective story of non-profits in BC that continue to be Stretched Thin.